
Supporting the behavioral health of rural left-behind children through rural education: a multi-dimensional demands-driven strategy study

Data collection was conducted in three stages
Firstly, to identify the initial demand for rural education among left-behind children, researchers adopted purposive sampling. Between April and May 2025, we conducted face-to-face semi-structured interviews with 32 left-behind children30. Interviews were conducted in quiet classrooms at the their schools to ensure a familiar, low-pressure environment. Only the researcher and interviewee were allowed in the room, enabling each child to freely express genuine thoughts and minimizing potential sources of bias. The interview outline comprised 10 questions, with each session lasting approximately 30 min. All participant information was protected.
In the second phase, we designed the Kano questionnaire based on the analysis results from semi-structured interviews. It consists of two parts: specifically, the first part covers basic information such as gender, age, and parental status, while the second part evaluates demand indicators. The Kano questionnaire format consists of each demand indicator paired with a set of function and dysfunction questions. Respondents select from five options ranging from “like” to “dislike,” enabling us to understand target participants’ perceptions. The questionnaire design is illustrated in Table 1.
Taking one stable teachers (A4) as an example, its positive asking method is: If stable teachers (A4) were available in rural education, how would you feel? The negative asking method is: If stable teachers (A4) were not available in rural education, how would you feel? Respondents could select one option from five choices; thus, each pair of questions could form 5 × 5 = 25 response combinations. Based on the respondent’s response combination and referencing the Kano model evaluation matrix (see Table 2), each demand is categorized as must-be quality (M), one-dimensional quality (O), attractive quality (A), indifferent quality (I), reverse quality (R), or questionable (Q).
At this stage, we used stratified random sampling. As mentioned earlier, we had identified eight schools willing to participate in this study. To ensure the sample distribution structure remained consistent with the study population and to avoid sampling bias caused by artificial equal distribution, we allocated the number of questionnaires proportionally based on each school’s actual student size and gender ratio. After obtaining student rosters for each grade level ( primary grades 3–6 and junior high grades 1–3), we imported student ID numbers into Excel for computerized random sampling. During sampling, homeroom teachers were only responsible for notifying students and did not participate in student selection, questionnaire distribution, filling out, or collection. The entire process was executed solely by research team members, who explicitly informed students that there were no right or wrong answers.
After the field survey, the total enrollment across these eight schools did not exceed 5,000 students. Based on Raosoft’s sample size calculation, a total sample of 357 participants is sufficient. Considering potential unforeseen factors during questionnaire collection, this study will distribute an additional 20% of questionnaires. Due to age and economic factors, mobile phones have not been fully popularized among students; therefore, an offline questionnaire was adopted. Data were collected in June 2025. Participants took approximately 10–12 min to complete the questionnaire.To express our gratitude while avoiding potential bias caused by incentive measures, we did not inform participants about the gift beforehand; the gifts (stationery items) were presented only after data collection was completed.
Additionally, before the formal questionnaire distribution, we firstly invited 50 left-behind children to participate in a pilot study to test the readability of questionnaire items and their alignment with the children’s cognitive abilities. The results of the reliability and validity analysis showed a Cronbach’s α coefficient of 0.935, a KMO value of 0.896, and a Bartlett’s sphericity test significance of 0.000 < 0.01, indicating excellent reliability and validity.
In the final stage, we invited 12 experts to conduct an AHP assessment of the demand indicators using snowball sampling to identify the priority order. Among them, three experts were engaged in child psychology research, three were from rural schools, three were from county education bureaus, and three were from the Child Welfare Research Institute. Detailed information is presented in Table 3. To ensure consistent scoring interpretation, we provided experts with thorough explanations and clarifications. After collecting each expert’s scoring matrix, we calculated the final scores for primary and secondary indicators using geometric mean methods.
Data analysis
We obtained the left-behind children’s initial demand regarding rural education through semi-structured interviews. Semi-structured interviews are a qualitative research method that allows for adjusting the questioning approach and sequence based on specific circumstances31. This approach permits raising new questions during the process based on the interviewee’s responses, offering strong flexibility and enabling deep insight into participants’ genuine thoughts and feelings32. The collected data underwent coding analysis using NVivo 12.0. This coding method provides researchers with a meticulous pathway to examine participants’ thoughts, perspectives, and reactions to the research topic33.
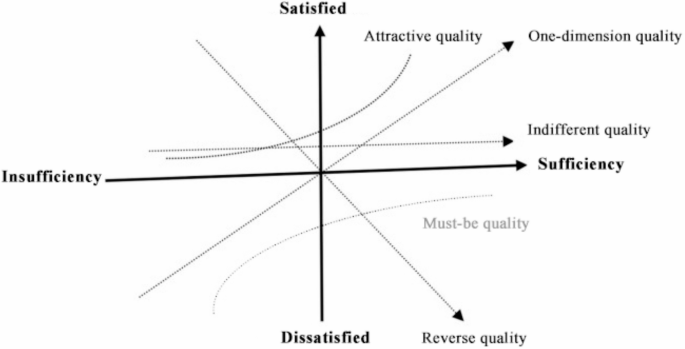
To achieve precise analysis of left-behind children’ demand, questionnaire data will be analyzed using a combination of Kano and Analytic Hierarchy Process (AHP) methods. Kano analysis will first categorize the demands of left-behind children, while AHP will help accurately determine the weighting of demand indicators for each dimension. The Kano model(see Fig. 1), proposed by Noriaki Kano in 1984, aims to clarify and identify the quality attributes of study objectives, where user satisfaction may change based on their preferences for these attributes34. He categorizes product quality attributes into five types:
(1)Must-be quality: Users take such attributes for granted as essential attributes or functions. Improving them does not help much, but worsening them will lead to dissatisfaction.
(2)One-dimensional quality: When it is sufficient, users are satisfied; otherwise, they are dissatisfied. User satisfaction is linearly proportional to its sufficiency. This category best reflects competitive capability.
(3)Attractive quality: Its adequacy will enhance user satisfaction, but its absence does not lead to dissatisfaction. This category represents users’ latent demand, which is highly conducive to increasing user loyalty.
(4)Indifferent quality: Whether sufficient or not, it will not affect user satisfaction.
(5)Reverse quality: User satisfaction is unrelated to this category; providing it rather leads to a decline in user satisfaction.
The Kano model identifies quality categories by calculating the better-worse coefficient, using the following formula:
$$\:\text{B}\text{e}\text{t}\text{t}\text{e}\text{r}/\text{S}\text{I}=\frac{(\text{O}\:+\:\text{A})}{(\text{M}\:+\:\text{O}\:+\:\text{A}+\:\text{I})}$$
(1)
$$\:\text{W}\text{o}\text{r}\text{s}\text{e}/\text{D}\text{S}\text{I}=-1\times\:\frac{(\text{O}\:+\:\text{M})}{(\text{M}\:+\:\text{O}\:+\:\text{A}+\:\text{I})}$$
(2)
When the better coefficient is less than 0.5 and the absolute value of the worse coefficient exceeds 0.5, it is classified as a must-be quality. When both the absolute values of the better and worse coefficients exceed 0.5, it is classified as one-dimensional quality. When the better coefficient exceeds 0.5 and the absolute value of the worse coefficient is below 0.5, it is categorized as attractive quality. When both the absolute values of the better and worse coefficients are below 0.5, it is classified as indifferent quality.
The Analytic Hierarchy Process (AHP), developed by Saaty, is a powerful multi-criteria decision-making tool that assists decision-makers in clarifying priorities and selecting optimal solutions35. It has been widely applied in various fields, including economics, politics, engineering, and tourism36. It is highly flexible, capable of being used independently or in combination with other tools37. Its steps include establishing a hierarchical model, constructing a comparison matrix, calculating weight vectors and performing consistency checks, and computing composite weight vectors36,38. Due to its inherent limitations, the Kano model cannot precisely evaluate the importance of different demands. Therefore, this study combines both types of analysis methods, not only classifying the demands of left-behind children but also determining the priority of each demand point.
This study used AHP to identify the weights of indicators. The specific process and steps are as follows:
1)Normalize the matrix with the formula:
$$\:{b}_{ij}=\frac{{a}_{ij}}{\sum\:_{i=1}^{n}{a}_{ij}}\left(i,j=\text{1,2},L\:n\right)$$
(3)
2)Sum the elements of the matrix:
$$\:{\stackrel{-}{w}}_{i}=\sum\:_{j=1}^{n}{b}_{ij}\left(i,j=\text{1,2},L\:n\right)$$
(4)
3)For \(\bar{w}_{i}\), in the above equation, normalize the calculation:
$$\:{w}_{i}=\frac{{\stackrel{-}{w}}_{i}}{\sum\:_{i=1}^{n}{\stackrel{-}{w}}_{i}}\left(i=\text{1,2},L\:n\right)$$
(5)
4)Calculate the maximum eigenvalue of the judgment matrix A:
$$\:{\lambda\:}_{max}=\frac{1}{n}{\sum\:}_{i=1}^{n}\frac{{(A\text{W})}_{i}}{{W}_{i}}$$
(6)
5)Test CI:
$$\:\text{C}\text{I}=\frac{{\lambda\:}_{max}-n}{n-1}$$
(7)
6)Test CR:
$$\:\text{C}\text{R}=\frac{\text{C}\text{I}}{\text{R}\text{I}}$$
(8)
If CR < 0.1, the consistency test is satisfied; otherwise, modify the judgment matrix.
Ethical considerations
Data collection for this study was approved by the Ethics Review Committee of Suzhou University (Approval No. ETH20250324-06–30 K) and written informed consent was obtained from participants. All study procedures were conducted in accordance with relevant institutional and national guidelines and regulations and comply with the Declaration of Helsinki and its subsequent amendments.
link