
Assessment of air pollution and mortality in Portugal using AirQ+ and the effects of COVID-19 on their relationship

Changes in air pollution levels over time and predicted health impacts
Table 1 shows the descriptive statistics of concentrations of air pollutants for 2020 and 2021. The results for the entire period (2010–2021) are presented in Table S.2. Figure 1 illustrates the yearly patterns of the mean levels of \({\text{NO}}_{2}\), \({\text{PM}}_{2.5}\) and \(\text{SOMO}35\), which is defined as \(\text{SOMO}{35}_{\text{uncorrected}}/{\text{N}}_{\text{valid}}\), used as input parameters for the AirQ+ model. Additionally, it presents the mean percentage of deaths attributed to exposure to each pollutant. These estimations were derived from all valid atmospheric data collected across 43 Portuguese municipalities for \({\text{NO}}_{2}\) and \({\text{PM}}_{2.5}\), and for 38 locations for \({\text{O}}_{3}\), from 2010 to 2021.

Mean values of indicators of atmospheric levels and estimates of attributable proportion of deaths over all municipalities in the observation period (2010–2021). Mean concentrations (lines), in µg/m3, of \({\text{NO}}_{2}\) (a), \({\text{PM}}_{2.5}\)(b), and \({\text{O}}_{3}\) (c) and mean AirQ + estimates of attributable proportion of deaths (bars), for each year, over all municipalities.
Linear Mixed Models applied to the analysis of time trends of the collected atmospheric data and AirQ+ estimates of attributable proportion of deaths in each municipality have shown that homogeneous variance–covariance matrices, namely the autoregressive first order and the autoregressive moving average matrices provide the best fit to the data.
The significance of the fixed effects (year as a categorical variable) in each LMM employed to analyze annual variations in pollutant levels and their attributable proportions of mortality was assessed using Type III Tests of Fixed Effects. All variables yield p-values \(<0.001\), indicating a strong influence of the year on pollutant levels and their attributable proportions. The pollutant levels and attributable proportions are described by the LMM equations shown in Table 2, in which the intercept represents the average value in the reference year (2010), while coefficients for each year (\({Y}_{2011},\dots ,{Y}_{2021}\)) indicate the deviation from the reference year. Positive coefficients indicate higher values compared to 2010, and negative coefficients indicate lower values.
Using the \({\text{NO}}_{2}\) equation as an example, the intercept \((18)\) represents the average \({\text{NO}}_{2}\) concentration (in µg/m3) in 2010. The coefficient for 2012 \((-1.2)\) indicates that the concentration was \(1.2\) µg/m3 lower in 2012 compared to 2010, while for 2021 the coefficient (\(-4.7\)) reflects a substantial reduction of \(4.7\) µg/m3 from the baseline. To supplement the LMM equations, all pairwise comparisons between years were performed for each variable to assess the statistical significance of differences. The complete results are presented in the supplementary material (Table S.3), providing detailed insight into year-to-year variations. On a cautionary note, the significance of the LMM coefficient estimates do not necessarily align closely with the significance of pairwise comparisons in Table S.3. This is because the former are unadjusted for multiple calculations, while the latter are adjusted to control the familywise error rate, which make it harder for pairwise comparisons to achieve significance. Nevertheless, a good agreement between significant results in both tables is observed. For example, the reduction in \({\text{NO}}_{2}\) levels from 2010 to 2013, estimated at \(3.3\) µg/m3 in the LMM equation, corresponds to a significant pairwise comparison between those years.
For \({\text{NO}}_{2}\) concentrations (Fig. 1a) in the period 2010–2021, there were significant differences between each year (from 2017 to 2019, excluding 2018), and year 2020, and significant differences between each year (from 2017 to 2019), and year 2021, with non-significant differences between 2020 and 2021 (Table S.3). \({\text{NO}}_{2}\), primarily emitted by the energy sector, especially the transport subsector, has been the dominant contributor to air pollution in Portugal’s major cities in recent years. The significant decline in \({\text{NO}}_{2}\) levels is likely linked to COVID-19 lockdowns, which sharply reduced atmospheric pollutant emissions and improved air quality in high-traffic areas23. Additionally, emissions from energy industries saw the largest drop between 2020 and 2021, driven by a shift to renewable energy (66% of production in 2021) and the complete cessation of coal use in electricity generation in 202124. The temporal trend of \({\text{NO}}_{2}\)-attributable deaths align closely with \({\text{NO}}_{2}\) levels, reflecting similar scales and statistically significant changes.
For \({\text{PM}}_{2.5}\) concentrations (Fig. 1b), in the period 2010–2021, there were significant differences between each year (from 2010 to 2019, excluding 2014 and 2016), and year 2020, and significant differences between each year (from 2010 to 2019, excluding 2014, 2016, 2018 and 2019), and year 2021, with non-significant differences between 2020 and 2021 (Table S.3). \({\text{PM}}_{2.5}\) emissions primarily originate from commercial, institutional, residential, industrial, manufacturing, construction, and transportation sectors25. The European Environment Agency (EEA) also identifies agricultural practices, wildfires, and North African dust as contributors26. Although COVID-19 lockdowns improved air quality, the reduction in \({\text{PM}}_{2.5}\) levels was less pronounced than \({\text{NO}}_{2}\), due to its diverse sources and meteorological influences23. The slight rise in concentrations from 2020 to 2021 likely reflects the lifting of lockdown restrictions and resumption of economic activity. Trends in \({\text{PM}}_{2.5}\)-attributable deaths mirror concentration patterns over time, as expected.
For the \(\text{SOMO}35\) indicator of \({\text{O}}_{3}\) exposure (Fig. 1c), there was a slightly, yet not statistically significant increase in the period 2020–2021 when compared with 2019. Tropospheric \({\text{O}}_{3}\) concentration patterns and annual fluctuations are complex, influenced by proximity to \({\text{O}}_{3}\) precursor sources (\(\text{NO}_{x}\) and VOCs), geography, and meteorological conditions. Despite the COVID-19 pandemic, \({\text{O}}_{3}\) levels did not decrease like other pollutants, as it is a secondary pollutant formed under high atmospheric stability and solar radiation, particularly in summer23. The rise in \({\text{O}}_{3}\) levels alongside significant \({\text{NO}}_{2}\) reductions in 2020–2021 reflects reduced \(\text{NO}\) availability limiting \({\text{O}}_{3}\) removal via titration27. The temporal trend of respiratory disease-related deaths linked to \({\text{O}}_{3}\) exposure mirrors these patterns, despite challenges in attributing emission sources to observed \({\text{O}}_{3}\) concentrations28.
A recent study29 discusses the complex challenge of managing ozone pollution, emphasizing the need for strategies beyond traditional air pollution control methods. It highlights the importance of addressing climate change, which affects ozone formation, and suggests measures such as controlling wildfires and reducing vehicle emissions to mitigate ozone levels. Additionally, selecting low biogenic BVOCs emission plants for urban green spaces can help improve air quality and decrease ozone precursors.
These findings demonstrate the effectiveness of the AirQ+ model and LMM data analysis in detecting temporal health impacts from pollutants. The methodology identifies changes from events like pandemic and emission reduction efforts, aiding authorities in setting and evaluating goals to minimize health impacts from air pollution, even at low exposure levels, despite source attribution challenges.
Excess incidence attributable to \({\text{NO}}_{2}\), \({\text{PM}}_{2.5}\) and \({\text{O}}_{3}\) in the population at risk
Table 3 presents the number of premature deaths from natural causes attributed to exposure to \({\text{NO}}_{2}\) and \({\text{PM}}_{2.5}\), along with respiratory illnesses associated with \({\text{O}}_{3}\) exposure, per 100,000 population at risk for the years 2020 and 2021. These figures were determined using two approaches: first, by averaging AirQ+ estimates of excess cases across all municipalities included in this analysis, and second, by applying AirQ+ directly with the total population at risk and weighted average atmospheric concentrations from the full dataset as inputs. Results covering the entire period from 2010 to 2021 are detailed in Table S.4.
The estimated excess incidence shows a reasonable level of consistency between the two methods for \({\text{PM}}_{2.5}\) and \({\text{O}}_{3}\), but not for \({\text{NO}}_{2}\). For \({\text{NO}}_{2}\), the annual weighted average is heavily influenced by elevated concentrations in larger urban centers. As a result, AirQ+ estimates for the entire country tend to be higher compared to the arithmetic average of model estimates across municipalities, where equal weight is assigned to each municipality. Nevertheless, estimates derived from the arithmetic means are also compromised by concerns over the unrepresentativeness of the monitors, which limits their ability to produce accurate country-level estimates.
These discrepancies are considered here to illustrate the methodological challenges faced by air quality studies conducted by international agencies in Europe. Indeed, research employing the entire country as the unit of analysis, without sub-national disaggregation, may potentially yield an imperfect understanding of the true extent of the environmental burden of disease. Moreover, these agencies assess the health effects of \({\text{NO}}_{2}\), \({\text{PM}}_{2.5}\) and \({\text{O}}_{3}\), using endpoints, population age groups, and cut-off values that diverge slightly from those proposed by the “Health risks of air pollution in Europe” (HRAPIE) project30 for specific pollutant-outcome pairs.
The annual number of premature deaths tends to be higher when \({\text{PM}}_{2.5}\) is used as a marker for the air pollution mixture, as shown in Table S.4, with the exception of the period 2017–2018. Given the preference for using the higher of the two individual pollutant estimates (\({\text{NO}}_{2}\) and \({\text{PM}}_{2.5}\)) to assess the effects of their mixtures31, it can be concluded that the annual number of premature deaths attributable to these mixtures in Portugal ranged from 5,071 to 6,413 deaths per year over the period 2010–2021. Additionally, the estimated annual premature deaths from respiratory diseases in the population at risk ranged from 139 cases in 2021 to 242 cases in 2013, based on AirQ+ modeling.
Impact of the COVID-19 pandemic on the long-term assessment of the relationship between atmospheric pollution and mortality in Portugal
A reliable long-term assessment of the environmental burden of disease using the AirQ+ model requires long time series data on mortality and air pollution levels, from which the quantities of interest are calculated to generate model estimates. As noted above, the estimates of the proportion of deaths attributable to exposure to a given pollutant are determined by the baseline mortality and average concentrations of the pollutant, both of which are required as model inputs. Conceivably, any sudden disturbance in the abovementioned time series due to unexpected factors, such as the COVID-19 pandemic and its associated increased mortality and reduced air pollution levels, could affect the AirQ+ inputs and estimates to an extent that does not exclusively reflect the adverse effects of air pollution on human health.
In this scenario, the expected baseline mortality from all natural causes and respiratory diseases in the population at risk, as well as the expected atmospheric levels of \({\text{NO}}_{2}\) and \({\text{O}}_{3}\) for the COVID-19 period (2020–2021), were calculated based on the observation of the available time series in an extended pre-COVID-19 period (1 January 2015–31 December 2019). The aim was to assess the impact of the pandemic on the quantities of interest used with AirQ+, and ultimately, on the AirQ+ estimates of the environmental burden of disease during the COVID-19 period of 2020–2021. This assessment focused specifically on the effects of \({\text{NO}}_{2}\) and \({\text{O}}_{3}\) exposure on mortality from all natural causes and respiratory diseases in the population at risk. It is noteworthy that \({\text{PM}}_{2.5}\) series was not included in this assessment because the database for \({\text{PM}}_{2.5}\) in Portugal during the considered period is incomplete, and not all monitoring stations measure this pollutant. Some stations measure \({\text{PM}}_{10}\) instead of \({\text{PM}}_{2.5}\). To avoid relying on estimates based on the correction factor described in Sect. 1.1 (Supplementary Material), we choose to use the pollutant with the most complete and continuous time series data, \({\text{NO}}_{2}\). This decision was also influenced by the wide range of sources contributing to \({\text{PM}}_{2.5}\) levels and the significant impact of meteorological conditions on its measured concentrations.
Therefore, time series analysis was performed to select the best fitting model for the observed number of deaths from all natural causes and from diseases of the respiratory system in the adult population prior to the COVID-19 era, and to forecast the mortality from each of those causes for the period 2020–2021.
Figure 2 shows the monthly number of deaths from all natural causes and respiratory diseases observed between 2015 and 2021, and the monthly atmospheric concentrations of \({\text{NO}}_{2}\) and \({\text{O}}_{3}\) in the same period in Portugal. Examination of Fig. 2 reveals important patterns in the observed data during the pre-COVID-19 period, such as the marked seasonal pattern of all the series, with a suggested periodic behavior occurring every 12 months. This seasonality is evidenced by the highest mortality and atmospheric concentrations of \({\text{NO}}_{2}\) in the winter months and secondary peaks in the summer, while the seasonality of the atmospheric concentrations of the \({\text{O}}_{3}\) series is evidenced by higher concentrations in the summer and secondary peak in the winter. Taken together, these observations suggest that none of the series are stationary or in statistical equilibrium, an important data requirement for the development of forecasting models. However, the application of the ADF test has shown that all the series can be made stationary by appropriate differencing of the data, as suggested by the significant results of the test \(\left(p<0.01\right)\), which guarantees the appropriateness of the modeling procedures.
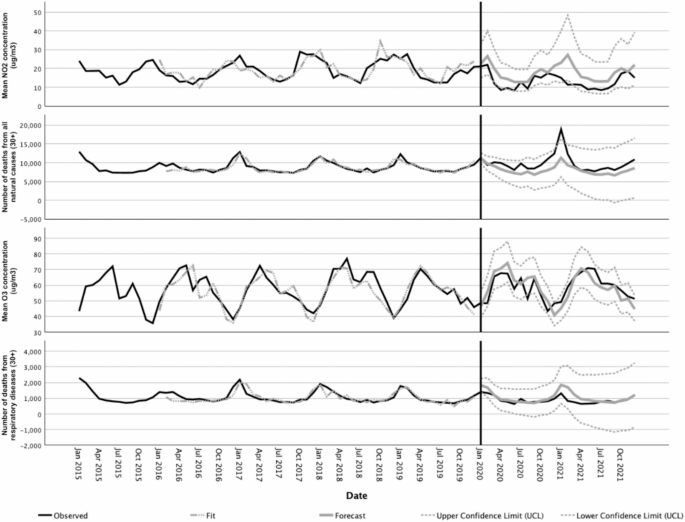
Observed and forecasted values for the time series of \({\text{NO}}_{2}\) and \({\text{O}}_{3}\) concentrations (in µg/m3) and different mortality causes in the period 2015–2021.
In line with these observations, the Time Series Modeler procedure has selected Seasonal Auto-Regressive Integrated Moving Average (ARIMA) models as the best models to fit the observed mortality time series prior to the COVID-19 era (see ARIMA models description in the Supplementary Material). Another potential approach could have been the use of contemporary techniques like machine learning (ML). The distinction between classical statistical techniques like ARIMA and ML approaches is nuanced. While ML models excel at capturing complex, non-linear relationships in data, they often require larger datasets than the one used in this study and tend to sacrifice interpretability. In contrast, ARIMA has remained a widely used and effective tool for forecasting in contexts with limited data, as highlighted in recent comparative reviews32,33.
Forecasts for mortality and atmospheric concentrations of \({\text{NO}}_{2}\) and \({\text{O}}_{3}\) and their confidence limits according to the selected models for the COVID-19 period are shown in Fig. 2. The predictions of each ARIMA model were compared with the observations to assess the impact of the pandemic on the relationship between pollution and mortality during this period. This was done using the LMM approach with an unstructured variance–covariance matrix. For \({\text{NO}}_{2}\), the observed values were significantly lower \((p<0.001)\) than the predicted values. For \({\text{O}}_{3}\) concentrations, the model predictions were not significantly different from the observed values \((p=0.849)\). For deaths from all natural causes the observed values were significantly higher than the predicted values \((p<0.001)\), whereas for deaths from respiratory diseases the observed values were significantly lower than the predicted values \((p=0.004)\). These outcomes are consistent with the plotted data in Fig. 2 and are taken here as evidence that the long-term behavior of the mortality time series for all natural causes and respiratory diseases changed significantly during the COVID-19 period covered in this study.
These findings are further corroborated by numerous studies that consistently highlight the significant impact of the COVID-19 pandemic on air quality and mortality patterns. For instance, global and regional analyses have reported substantial reductions in \({\text{NO}}_{2}\) and \({\text{PM}}_{2.5}\) concentrations during lockdown periods, while \({\text{O}}_{3}\) levels increased as \(\text{NO}_{x}\) emissions declined34,35. Additionally, notable variations in mortality rates were observed, with some regions experiencing higher-than-expected deaths from all natural causes, while others saw decreases in mortality from respiratory diseases36. These studies align with and reinforce our findings, emphasizing the role of pandemic-induced behavioral and environmental changes in shaping these outcomes.
The impact of these changes on the AirQ+ estimates of the environmental burden of disease attributable to \({\text{NO}}_{2}\) and \({\text{O}}_{3}\) exposure during the COVID-19 period was assessed. The observed versus expected values of the attributable proportion of deaths (AP) and the excess incidence (EI) of deaths from natural causes attributable to \({\text{NO}}_{2}\) and from respiratory diseases attributable to \({\text{O}}_{3}\), per 100,000 population at risk in Portugal were calculated and are shown in Table 4.
Taken together, the data presented in Fig. 2 and shown in Table 4 suggest that the AirQ+ estimates of the attributable proportion and the excess incidence of deaths from natural causes per 100,000 population at risk for the COVID-19 period suggest a steady decline in the environmental burden of disease in association with \({\text{NO}}_{2}\) exposure. Those estimates, however, should be perceived as singularities due to the severe disruption of the mortality and atmospheric pollution time series data in that period, instead of a result of the implementation of policies targeting a better health and environment in Portugal.
In fact, there is no evidence that living conditions that have an impact on health, as well as the quality of health services in Portugal, have suddenly improved in 2020–2021, to the point of justifying the significant decrease in the environmental burden of disease due to \({\text{NO}}_{2}\) exposure. In contrast, data from 2021 show that during the first 12 months of the COVID-19 pandemic, the proportion of unmet medical care needs have increased in Portugal (and in most Organization for Economic Cooperation and Development (OECD) countries), with an estimated percentage of 34% in Portugal for the first 12 months of the pandemic, which is higher than the average of the OECD (22%)37.
These observed trends in mortality figures and their future evolution should be analyzed in the light of the challenges faced by the Portuguese National Health System following the COVID-19 outbreak. In fact, the deficiencies of the health services in managing non-COVID cases, coupled with public fear of the virus, caused a decrease in follow-up consultations, screening tests and diagnoses as well as postponed surgeries. Consequently, urgent healthcare seeking may have been delayed and advanced stage diagnoses may have increased, threatening treatment effectiveness and raising short to medium-term patient mortality.
The AirQ+ model, is a tool designed to estimate the health effects of air pollution. While it offers robust quantitative insights, its utility in assessing progress towards the Sustainable Development Goals (SDGs)—notably SDG 3 (Good Health and Well-being) and SDG 11 (Sustainable Cities and Communities)—has been undermined by the unprecedented challenges posed by COVID-19.
Health impacts were further complicated by overlapping risks from COVID-19 and air pollution, making it difficult to isolate specific effects, particularly for vulnerable populations. Respiratory deaths attributable to COVID-19, included in all-cause mortality data, could mask the contribution of air pollution to respiratory and cardiovascular outcomes. Additionally, the concentration–response functions (CRFs) utilized in this study, as recommended by the WHO for the AirQ+ model, do not account for the disproportionate impact of COVID-19 on respiratory mortality, resulting in potentially biased estimates. Future research should explore the development of modified CRFs that incorporate pandemic-related mortality dynamics.
Data collection challenges, including monitoring disruptions and delays in reporting, compromised the model’s reliability. Behavioral and economic shifts, like reduced industrial activity introduced anomalies not accounted for by the AirQ+ model. Additionally, its narrow focus on air pollution health impacts fails to address broader SDG dimensions such as healthcare access and economic resilience, making it less relevant in capturing holistic progress.
To continue serving as a useful tool for assessing SDG progress, the AirQ+ model could benefit from recalibration to address limitations highlighted by the COVID-19 pandemic. Adjusting for adaptive baselines may help enhance its relevance. Additionally, linking AirQ+ outputs with broader indicators of resilience and equity might provide a more comprehensive view of progress toward sustainable development. These refinements have the potential to improve the AirQ+ model’s effectiveness in the post-COVID context.
In summary, sudden disturbances, such as the COVID-19 pandemic, which increased mortality from multiple factors and reduced pollution levels due to lockdown, have the potential to distort the relationship between air pollution and mortality, and thus, the true impact of air pollution on health. Therefore, caution is advised when using long time series on mortality and air pollution levels to generate accurate data to support effective policies and track progress toward the SDGs.
link