


Study area, design, and participants
This study was a retrospective cohort study. We investigated the impact of previous environmental exposure on the risk of developing MetS and its components. Participant data was collected from the MJ Health Database (MJHD) to include 10,997 Taipei City residents who underwent at least two health checkups at the MJ Health Management Institution, a private healthcare firm in Taiwan, between 2010 and 2016. The MJ Health Database is a longitudinal, large-scale, comprehensive population-based health database. For each examination visit, information on behavior and lifestyle was collected via a self-administered health questionnaire. Data on anthropometric and biological tests were collected via health checkups.
Figure 1 shows a flowchart of the data-selection process. The initial study participants included 50,777 individuals who underwent health check-ups between 2010 and 2016. Participants were eligible if they did not develop MetS during the first examination. We excluded participants who (1) had only received one health checkup (N = 33,948), (2) had missing data on outcome and confounding variables (N = 3959), (3) took long-term medication (N = 897), and (4) had incident MetS at their first visit (N = 1226); the remaining 10,773 participants were enrolled and followed up for MetS.

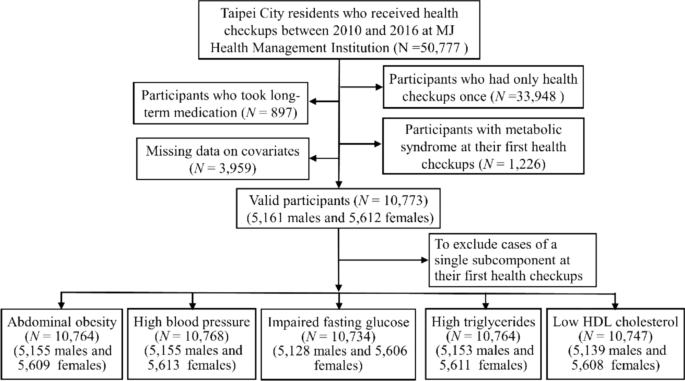
The flowchart of participants’ selection. The flowchart shows the exclusion criteria for participant selection and shows the final number of participants included (N = 10,773 and their distribution across the different subcomponents of the metabolic syndrome).
To further assess the risk of environmental exposure for each subcomponent of MetS, the respective baseline sample for each subcomponent was composed of the data from valid participants who were tested negative for that subcomponent at their first health checkup. Therefore, we included N = 10,764 for abdominal obesity, N = 10,768 for high blood pressure, N = 10,734 for impaired fasting glucose, N = 10,764 for high triglycerides, and N = 10,747 for low HDL cholesterol. The follow-up period was from the date of their previous health checkup to the date of the health checkup for MetS or a single subcomponent. For participants without MetS or any single subcomponent, the follow-up period ranged from the date of their first health checkup to the date of their last health checkup.
The geocoding process was handled by the MJ Health Resource Center before being released to the data users. They used two geocoders to geocode the addresses from health check-up visits, including the official geocoder, TGOS ( operated by the Ministry of Interior, Taiwan, and the Google Map geocoding service ( Our research team used the released coordinates to link exposure to noise and PM2.5.
Outcome definition
According to the Health Promotion Administration, Ministry of Health and Welfare, Taiwan, metabolic syndrome in Taiwan is diagnosed with the presence of at least three of the following five criteria: (1) abdominal obesity: waist circumference ≥ 90 cm in men and ≥ 80 cm in women (2) high blood pressure: systolic blood pressure ≥ 130 mmHg or diastolic blood pressure ≥ 85 mmHg (3) impaired fasting glucose: fasting plasma glucose ≥ 100 mg/dL (4) high triglycerides: triglycerides ≥ 150 mg/dL (5) low HDL cholesterol: HDL cholesterol < 40 mg/dL in men and < 50 mg/dL in women34.
Venipuncture was performed to collect overnight fasting blood for a series of biochemical analyses, including lipid profile, renal function, liver profile, and serum albumin, globulin, and uric acid levels. All biological specimens were analyzed in a laboratory located at the MJ Health Screening Center. A standardized service workflow was adopted by all four health-screening centers in Taiwan that conformed to ISO 9001-2008 requirements for quality management systems. The MJ Health Screening Center laboratories participated in College of American Pathologists Proficiency Testing to ensure their ability to generate good-quality health data.
Exposure measurement
Personal PM2.5 exposures were assessed using high-resolution, specified air pollution datasets maintained by the Atmospheric Composition Analysis Group of Washington University in St. Louis. These were global estimates of ground-level ambient PM2.5, which were gridded at approximately 1 km × 1 km35. The PM2.5 concentrations were available at a monthly timescale for the years 2010 through 2016. Briefly, PM2.5 was estimated based on several satellite aerosol optical depth (AOD) products, and then combined with chemical transport model simulations to relate AOD to the estimated surface-level PM2.5 concentrations. The estimated monthly PM2.5 concentrations were validated against ground PM2.5 concentrations measured at fixed monitoring stations across Taipei City. The PM2.5 estimates exhibited general consistency with ground-based observations, with a Pearson correlation coefficient of 0.69. The model accuracy was evaluated by mean absolute error (MAE) = 4.31 µg/m3, and root mean square error (RMSE) = 5.42 µg/m3.
Noise exposure was assessed based on road traffic noise levels. The hourly noise levels for road segments were estimated using noise prediction models with traffic conditions and road attributes as inputs36. Historical traffic condition data collected by available overhead microwave vehicle detectors in Taipei City were provided by the Department of Transportation, Taipei City Government. The geographical data included road network and building data in a vector format. Information on the road segments includes the following attributes: road identification (ID), road name, length, width, number of lanes, and road class. A-weighted sound pressure levels in decibels (dBA) were estimated over 24 h. We assumed that the hourly noise levels of each participant depended mainly on the noise generated by the nearest road segment. The estimated hourly noise levels were validated against the traffic noise monitoring sites in Taipei City. The Pearson correlation coefficient between the estimated and measured hourly 24-h and nighttime noise levels were 0.70 and 0.54, respectively. The accuracy analysis showed that the hourly MAE and RMSE were 3.49 and 2.62 dBA for 24-h noise levels and 3.08 and 4.03 dBA for nighttime noise levels. Furthermore, the monthly average noise levels during the day, evening, and night (24 h, Lden indicator) and the average nighttime (23:00–6:00) exposure (Lnight indicator) were calculated based on the noise prediction models for each road segment.
Covariates
Covariates were selected for model adjustment based on a self-administered questionnaire administered prior to the final health checkup. This was divided into six categories: basic information, family health history, current health status, lifestyle, physical activity, sleep duration, and dietary habits. Basic information included age (20–39 years, 40–49 years, 50–59 years and > 60 years), sex, smoking status (never smoked, former smoker, current smoker), drinking status (never drank, former drinker, current drinker), education level (high school diploma or less, bachelor’s degree, and master’s degree or above), and marital status (single, married/cohabitating, widowed, and divorced). Family health history of chronic diseases, which is a record of the relationships among family members along with their health histories, was categorized as yes or no. Biweekly physical activity was broadly classified into four categories (< 30 min, 30–60 min, 60–120 min, and > 120 min). The sleep durations were less than 6 h, 6–8 h and over 8 h. Eat-on time and regular amounts, at least 1 serving of rice or flour products, at least 1 serving of meat, at least 1 serving of vegetables, and at least 1 serving of fruits were categorized as yes or no, respectively.
Statistical analysis
MetS and its five subcomponents were investigated separately as outcomes. Cox proportional hazards regression models with month as the underlying time scale were used to estimate hazard ratios (HRs) for the impact of PM2.5 and road traffic noise exposure on the risk of developing MetS or its subcomponents. Participants were censored if they did not have MetS at their final health checkup or if they were diagnosed with MetS at one of their previous health checkups.
Monthly PM2.5 and road traffic noise exposures were treated as continuous variables.
We first conducted single exposure analyses for PM2.5 and road traffic noise. Subsequently, a co-exposure analysis was conducted for both PM2.5 and road traffic noise. Finally, co-exposure analysis of both PM2.5 and nighttime noise was used to examine the harmful effects of road traffic noise during sleep. To investigate the interaction between air and noise pollution, we used the median as the cut-off value for each pollution exposure categories in the co-exposure models to divide valid participants into high and low-exposure groups. All Models were adjusted for basic information, family health history, lifestyle, physical activity, sleep duration, and dietary habits, which were considered as confounders, and investigated how these covariates modified the associations between the development of MetS or its subcomponents and environmental pollution exposure. Pearson’s chi-square tests were also performed to investigate the association between covariates and the frequency of incident MetS. The significance level was set at p < 0.05 for all statistical tests. All analyses were performed using the R software (version 4.0.4, R Development Core Team, The maps created using the Free and Open Source QGIS by using Version 3.14.15 (https://www.qgis.org/en/site/).
Ethical approval
Informed consent was obtained from all the participants. This study was approved by the Institutional Review Board on Biomedical Science Research, Academia Sinica (AS-IRB-BM-22008). Individually identifiable health data were removed and anonymized throughout the study. This study was performed in accordance with the Declaration of Helsinki and followed an approved protocol.
link