


Noise monitoring, 2D noise mapping, validation of noise prediction model and mitigations measures have been discussed in the subsequent sections of results and discussion.
Noise monitoring
Twenty locations selected on the basis of traffic volume in the study area of Jammu, Rajouri, Poonch and Nowshera have been monitored for noise levels and the observed results are as follows:
Jammu
Five locations in the city of Jammu have been monitored for the day and night noise levels as the Central Pollution Control Board (CPCB) standards for day and night noise level are 55 dB(A) and 45 dB(A) respectively. Figure 4 shows the variation of noise level at the five selected locations of Jammu city during day and night. The highest noise level is recorded during the day at Bhatindi, around 91.4 dB(A) at 4 p.m., followed by Jalalabad Chowk Sunjawan where noise level was recorded to be 83.6 dB(A) at 4 p.m. Except between 6 and 9 a.m., the noise level is observed to be always higher than the CPCB regulation of 55 dB(A). During the night, between 1 a.m. to 5 a.m., however, the noise level remains under the CPCB limit of 45 dB(A), with only exception during the period of 11 p.m. to 12 a.m. at the midnight. This variation in the noise level can be attributed to the variation in the traffic flow. Noise level around 12 p.m. may be high due to lunch break, ending of school hours etc. Noise level is high at all the locations around 4 p.m. because of high traffic due to ending of office hours, shopping/marketing by residents and others. Generally closing time of shops and market is around 10 p.m. and after that noise levels starts decreasing and reaches to below 50 dB(A). Bhatindi has the highest noise level and recorded always above the permissible limit most of the time during the day and night. Hence, it need attention from federal agencies as the noise levels even above 40 dB(A) during night should be mitigated as the continuous exposure leads to adverse health effects4,35.

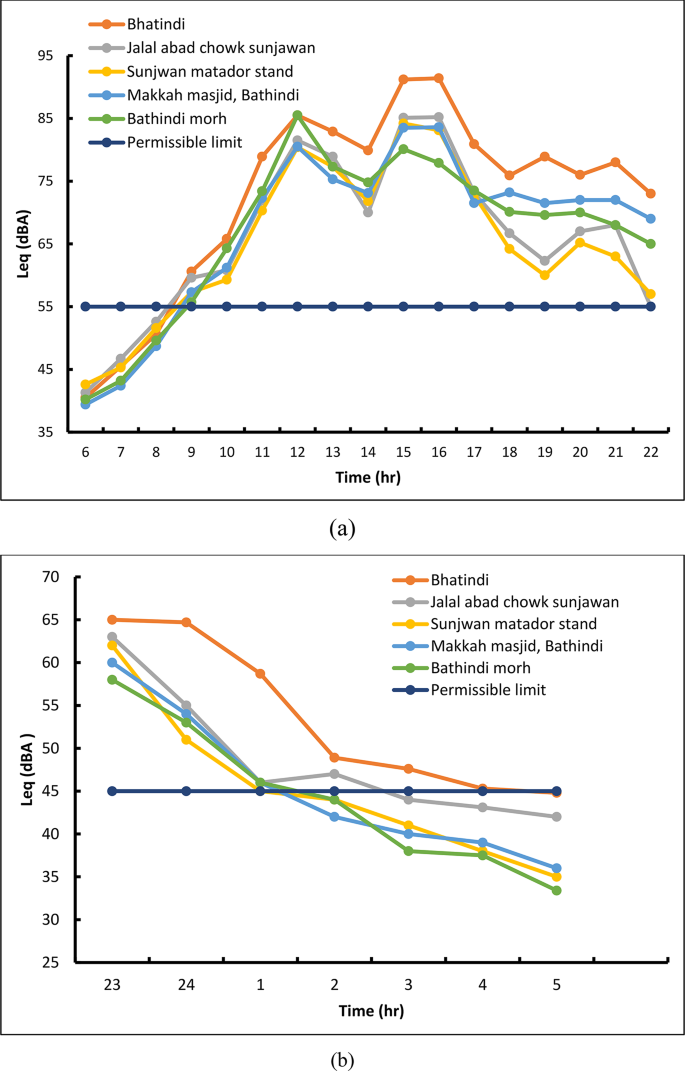
Variation in noise level at five selected locations of Jammu city during (a) day and (b) night.
Rajouri
In Rajouri also the noise levels have been monitored at 5 important locations with significant traffic flow. Variation of the noise levels in Rajouri during day and night can been seen in Fig. 5. The highest noise level has been recorded during the daytime at the Bus stand Rajouri, reaching to 90.1 dB(A) at 5 p.m., followed by 89.3 dB(A) at 4 p.m. at the same location. Notably, Doodhadhari temple is an exception, as it consistently maintains noise levels lower than the CPCB regulations during most parts of the day. Apart from Doodhadhari temple, the noise levels in the region typically exceed the CPCB regulation of 55 dB(A) throughout the day. However, during the midnight and early morning hours, i.e. around 1 a.m. to 6 a.m., the noise levels remain within the CPCB limits across the different monitored locations with exceptions of minor peaks recorded between 11 p.m. to 12 a.m. The variation in the noise levels follows the trend of traffic volume and congestion in most of the cases. Rajouri bus stand has high traffic volume and congestion during the day but after 7 p.m. buses plying to and from the bus stand decreases and become empty at around 11 p.m. Therefore, highest, and lowest noise levels are recorded at this location. Salani bridge is a tourist spot and therefore higher noise level recorded even during midnight periods. However, if the average night noise level over a year is above 55 dB(A), it is considered dangerous to public health, causing annoyance, sleep disturbance and risk of cardiovascular disease35.

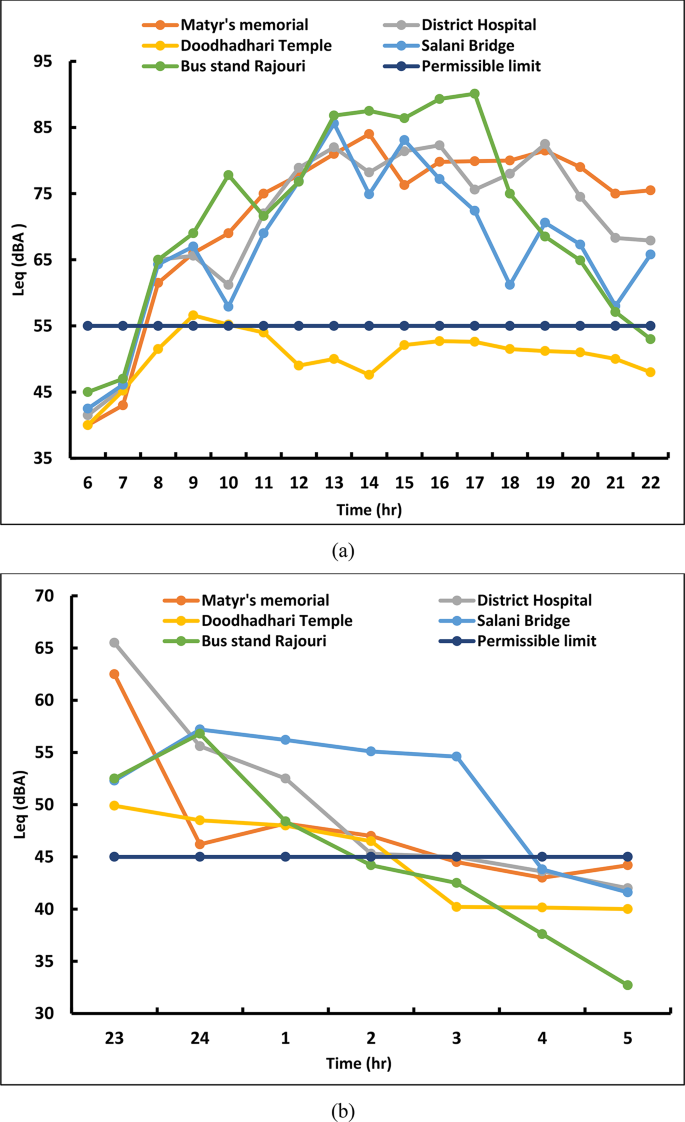
Variation in noise level at five selected locations of Rajouri during (a) day and (b) night.
Poonch
In Pooch, the variation of noise level recorded at five selected locations during day and night can be seen from Fig. 6. The maximum noise level during the day has been observed at Gurudwara Bhai Rocha Singh Ji, registering 90.5 dB(A) at 5 p.m. Following closely, Eidgah Chowk recorded a noise level of 90 dB(A) at 4 p.m. At these locations noise level is high for most of the day and exceed the permissible CPCB standard. These two locations are prominent place for markets and shops and experience congestion and large traffic volume even sometimes at night hours. After 12 a.m. midnight the noise level goes below 55 dB(A) and during the period of early morning after 3 a.m. the noise levels at most locations remain below 45 dB(A)and thus below the CPCB limit. High diurnal and nocturnal noise level is associated with various health problems36. Recio et al.37 reviewed the health effects of traffic related noise pollution and reported that respiratory disease, cardiovascular disease, and type 2 diabetes can be significantly associated with such high noise levels. Hence Poonch region specially Gurdwara and Eidgah chowk need attention from residents, and municipal authorities to curb the noise pollution.

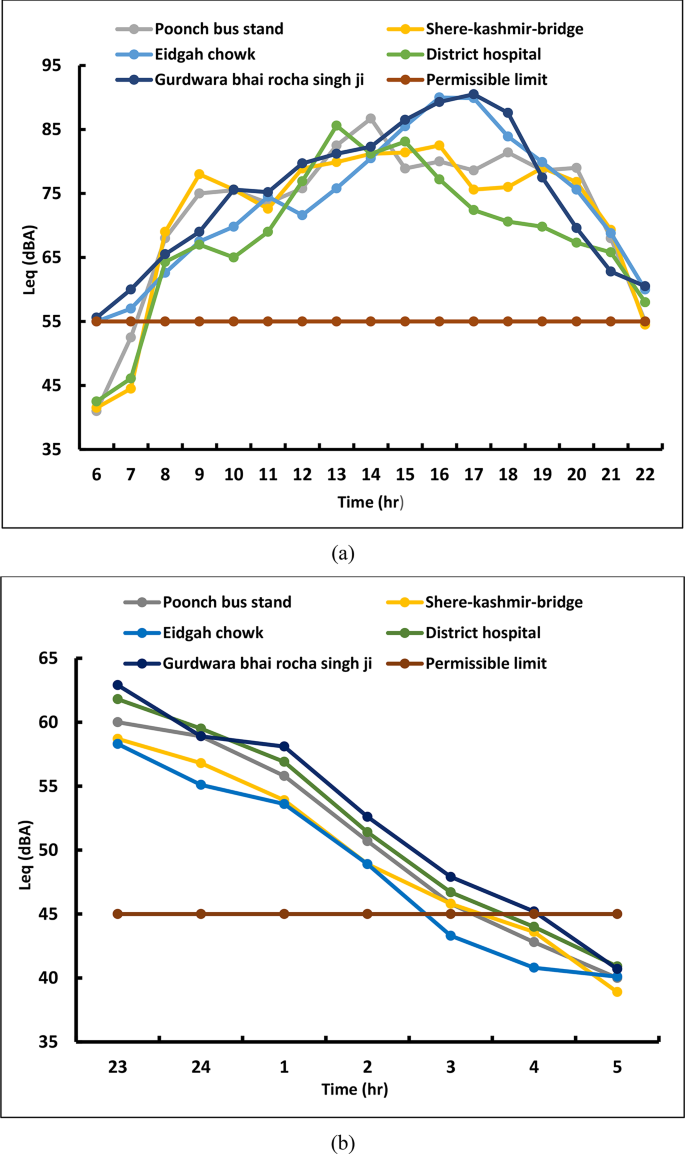
Variation of noise level at five selected locations of Poonch during (a) day and (b) night.
Nowshera
In Nowshera, Government hospital, Nowshera radio station, Gujral chowk, Lal Dwara, and Government degree college are selected for noise monitoring throughout the day and night. Figure 7 shows the variation of noise level during day and night at five selected locations of Nowshera. The highest noise level during the day is recorded at Nowshera radio station, recording 82.7 dB(A) at 10 a.m. An equally high noise level of 82.7 dB(A) was observed at Government degree college, registered at 9 a.m. whereas Lal Dwara recorded a noise level of 81.9 dB(A) at 9 a.m. Noise levels consistently surpass the prescribed CPCB limit of 55 dB(A) for most of the day in all the monitored locations. The trend of variation of noise level in Nowshera can be attributed to similar reasons as it is in case of Jammu. Between 8 a.m. to 10 a.m. traffic moving for schools, colleges, offices etc. leads to higher noise level. Again between 4 p.m. to 8 p.m. noise level is high due to high traffic volume and congestion arising from the commuters returning to home, going to markets, shops, and other recreational sites. After midnight the noise level reduces and at the early morning hours, the noise levels are below 45 dB(A), providing a quiet environment during early morning hours. However, near Gujral chowk and Government hospital noise level is not below the permissible limit neither during day nor during the night. Thus, it is a matter of concern and the noise levels around these locations need to be mitigated on priority basis for health and well beings of the public.

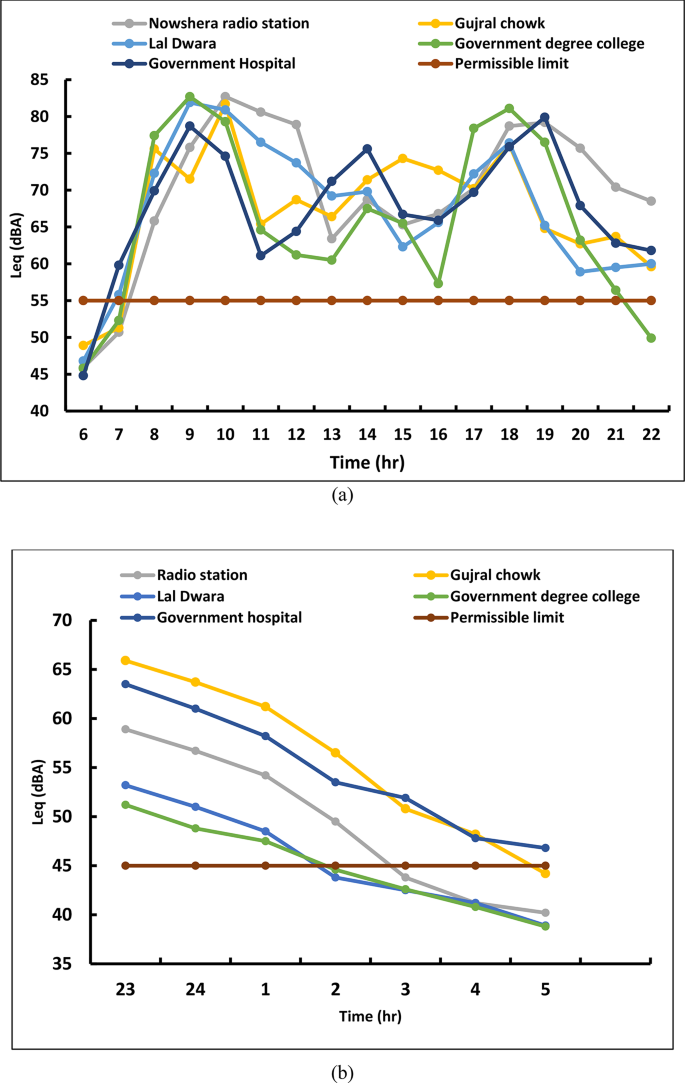
Variation in noise level at five selected locations of Nowshera during (a) day and (b) night.
Noise mapping
Validation of noise prediction model and 2D noise mapping for selected areas have been discussed in the subsequent sections of noise mapping.
Noise map validation
Validation of the noise map has been done by real time monitoring of noise level and comparing with the predicted value of noise and further analysing the results by t-test. Figure 8 shows the positions of SLM from the centre line of road for measuring the real time noise levels and the map generated using NoiseTools to predict the noise level at different distance from the noise source. The monitored and predicted noise levels at three locations are shown in Table 3. It can be seen from Table 3 that predicted noise levels are close to monitored noise levels with maximum standard deviation of 1.76. Hence, it can be inferred that noise mapping through NoiseTools produces good results and can be used for prediction of noise level.

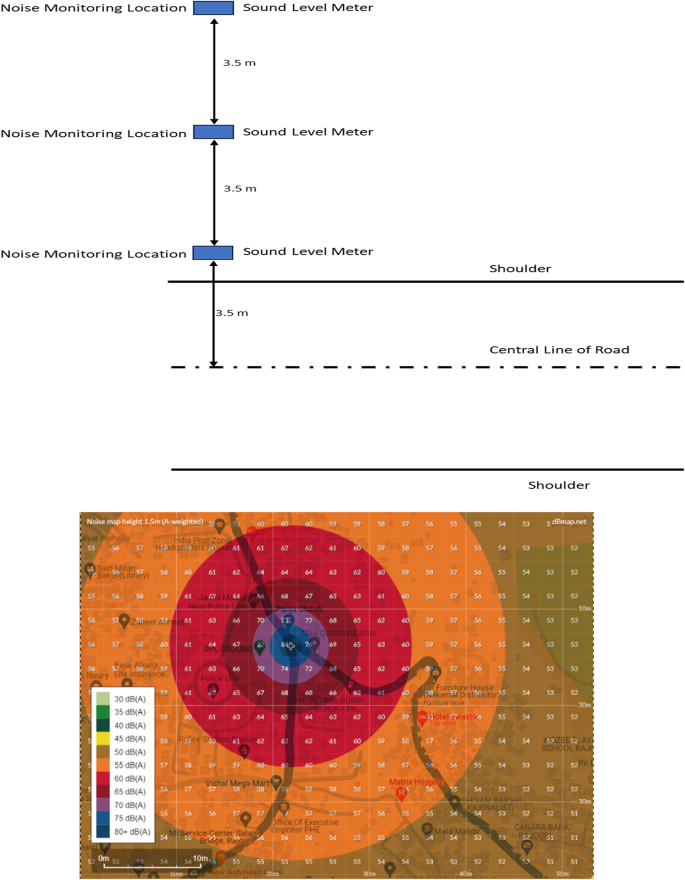
Noise mapping for validation.
Furthermore, unpaired t-test is performed to statistically assess the fitness of monitored and predicted noise level. Table 4 displays the results of the unpaired t-tests for the Leq noise level at the 5% significance level using the observed data. The NoiseTools produced a t-statistical value less than t-critical for a degree of freedom of 4 at a 5% significance level. The table presents the validation of a noise prediction tool using a T-test at a 5% significance level. It compares observed (measured) noise levels with predicted noise levels. The mean observed noise level is 66.03 dB(A), while the mean predicted level is 64.33 dB(A), with variances of 24.22 and 37.33, respectively, based on three observations each. The hypothesized mean difference is zero, indicating no assumed difference between the observed and predicted means. With 4 degrees of freedom, the calculated t-statistic is 0.375, which is less than the critical t-value for both one-tail (2.13) and two-tail tests (2.78). The p-values (0.36 for one-tail and 0.73 for two-tail) are higher than the 0.05 significance level, suggesting that there is no statistically significant difference between the observed and predicted noise levels. This indicates that the noise prediction tool performs well in estimating noise levels accurately.
Noise maps of study area
Noise mapping gives better idea about the propagation of noise levels in the X and Y directions. Therefore, in the present study 2D noise maps are developed for the locations with maximum noise level using the noise monitoring data. Additionally, it also provides the region and population exposed to loud noise. Noise maps of the selected locations are presented and discussed below.
Jammu
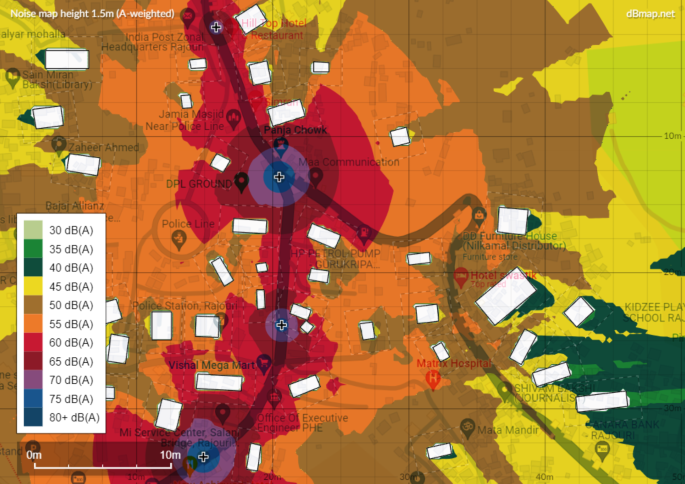
A comprehensive 2D noise map representing the noise level distribution in Bhatindi, Jammu city has been shown in Fig. 9. Notably, Bhatindi emerges as the area with a Leq noise level of more than 80–90 dB(A) as indicated by the colour Blue and Purple. This noise level can be attributed to various factors, such as the presence of multiple intersections and reflection of noise due to proximity of tall buildings in the vicinity, which collectively contribute to an increased acoustic disturbance during peak hours. According to hearing health foundation, New York, continuous exposure to noise level 55 dB(A) may lead to non-auditory negative health effects such as cardiovascular, respiratory, hypertension and metabolic disorder36,37. Conversely, there are regions within Bhatindi where the noise levels are comparatively lower, ranging from 55 –5 dB(A), denoted by Orange, Brown and Green colour on the map. These areas experience a relatively quieter environment due to fewer obstructions and lower concentration of bustling activities. The 2D noise map of Bhatindi serves as a valuable visual representation of the noise distribution across the area, highlighting the varying degrees of acoustic impact throughout the region.

2D noise of selected location of Jammu city.
Rajouri
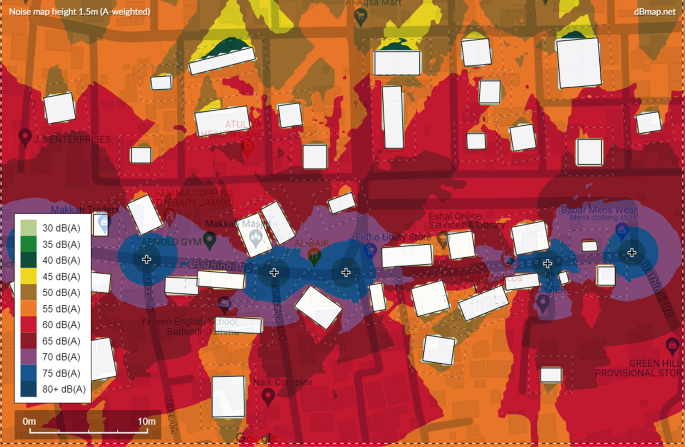
Figure 10 shows a comprehensive 2D noise map representing the noise distribution near the Bus stand, Panaja Chowk and Mandi in Rajouri. Notably, Rajouri emerges as the area with higher noise levels, reaching a noise level of 80 − 65 dB(A) as indicated by the colour Blue and Red at the centre of road that is more than the prescribed standard in daytime as well as during night. Prolonged exposure to such noise level to the street vendors, shop owners and workers at this area may negatively affect their health and may develop auditory and non-auditory problems3,35,36,38,39,40,41. However, after 2D mapping it is observed that buildings/structures distant from the road are within the prescribed standard of CPCB and not exposed to high noise level as they lie in the Orange, Brown and Green region and remain safe during the day and in the night as well. This is due to the neighbouring structures acting as a noise barrier for the distant establishment, reducing the noise level to the permitted CPCB standard.

2D noise map of selected location of Rajouri.
Poonch
The developed 2D noise map for the location experiencing highest noise level in Poonch is shown in Fig. 11. Poonch experience a relatively quieter environment in comparison to Jammu and Rajouri due to fewer obstructions and lower concentration of bustling activities. The noise level reaches to 70–5 dB(A) as indicated by the colour at the centre of road that is more than the prescribed standard in daytime i.e., 55 dB(A). Suárez and Barros42 carried out the noise monitoring of Santiago city and observed that the hourly average noise level was much greater during the day than during the evening hours because of the heavy traffic. However, it is discovered after 2D mapping that most of the buildings/structure lies in Brown and Yellow zone and people living near the selected location are safe due to a lower noise level in comparison to Jammu and Rajouri. This could be because roads in Poonch are wider than in other regions, resulting in reduced traffic volume and congestion.

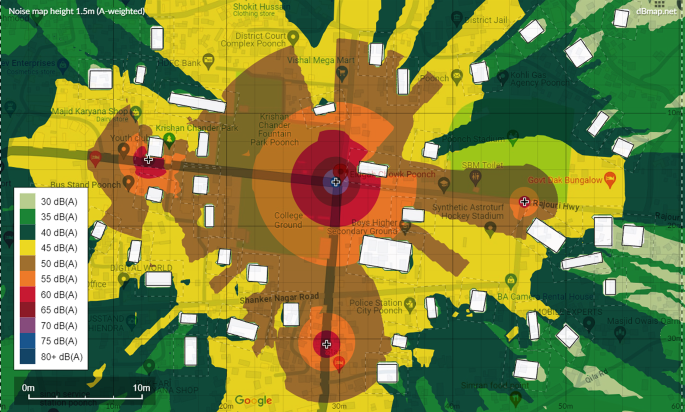
2D noise map of selected location of Poonch.
Nowshera
Figure 12 presents a comprehensive 2D noise map showcasing the noise distribution in Gujral Chowk and other area of Nowshera. Notably, Nowshera stands out as the area with noticeable noise levels, reaching a maximum of 65–55 dB(A) as indicated by the colors Dark red and Yellow on the map. Nowshera has the calmest surroundings out of all the places that are chosen. Less people and a lower building/structural density could be the cause of this. The 2D noise map also showed that, for the most part of the Nowshera, the noise level stays under the CPCB’s recommended standards. In a similar study conducted for Delhi, the regions with appropriate and well-controlled traffic movement had lower noise levels than places with poorly managed traffic, which leads to congestion and honking43.

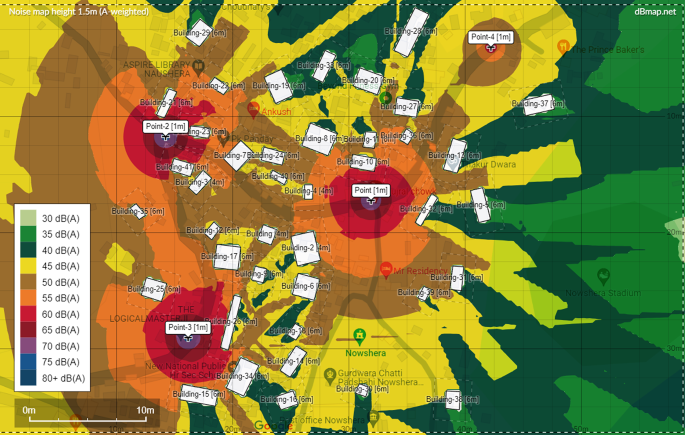
2D noise map of selected location of Nowshera.
Mitigation and control of noise pollution
Noise pollution should be kept at the forefront of health policies and should be targeted by policy makers for avoiding adverse health impact on the public4. CPCB restricted the noise level to be less than 55 dB(A) during daytime and 45 dB(A) during night as above these noise levels may cause non-acoustic health hazard36,38,39,41. WHO35 suggested the policy makers to mitigate the noise level above 40 dB(A) during night as the exposure to noise even above 30 dB(A) is linked to adverse health effects. However, the problem of noise pollution can be solved with the involvement of different stakeholders bearing collective and shared responsibilities. To alleviate noise pollution caused by traffic in the study area, several mitigation measures can be implemented. First and foremost, polycarbonate noise barriers44 must be installed along busy roadways in Jammu, and Rajouri which can effectively mitigate the transmission of sound waves into residential spaces. Because both of the studied locations have limited space, noise barrier would be an effective technique of reducing noise pollution. Furthermore, efficient traffic management, modified pavements and sustainable vehicles and tires can support the reduction in noise emission45.
Hospitals are noise sensitive area but generally located within or close to urban population and exposed to high level of noise due to traffic. Thus, requiring mitigation and preserving sensitive area against the noise exposure. Montes-González, et al.46 carried out the noise monitoring of a hospital in Spain and suggested mitigation measures like the reduction of speed limit to 30 km/h, no use of horn and use of porous asphalt pavement near hospital and predicted reduction in the noise level. Furthermore, establishing green spaces and planting dense vegetation belts of 10–15 m along highways in Poonch and Nowshera can reduce noise levels by up to 5–10 dB(A), serving as effective natural sound absorbers. The availability of open spaces in both study areas provides an opportunity to utilize these natural barriers to help mitigate noise pollution. Moreover, community awareness and education campaigns can educate residents about the detrimental effects of noise pollution and encourage responsible behaviour, such as avoiding unnecessary honking and maintaining vehicles properly to reduce noise emissions. A combination of these measures, tailored to the specific characteristics of the residential area, can contribute to a quieter and more peaceful living environment at the selected areas of Jammu province. Tobías et al.40 reported that a study in Madrid (Spain) found that 1 dB(A) decrease in diurnal noise levels resulted in reduction of around 200 deaths per year due to cardiovascular and about 300 deaths per year due to respiratory diseases. Such, results can be realized in other parts of the world too, preparing a safer and sustainable environment.
link