


Descriptive
The survey participants were adults 18 to 83 years of age who reside within zip codes in the San Joaquin Valley (SJV). The mean age of the whole sample was 42.90 (± 16.84) and 40.03 (± 14.92) years for people who have asthma themselves or have children with asthma, respectively. Table 2 summarizes the characteristics of the participants and reports the p-value for each reported characteristic of residents with and without asthma.
Among survey participants, the number of chronic diseases, health insurance type, employment status, and vaping use were significantly different between the entire sample population and people who were diagnosed with asthma or had a child who had asthma. Most respondents were female, White, spoke English and had the same distribution in the group of residents who had asthma. Hispanic/Latinos/Latinas accounted for approximately 32% of the entire sample and included residents with asthma. Most respondents in the whole sample reported being single (44.11%), but 54.26% of people with asthma reported being married or living with a partner and being employed full- or part-time. The entire sample included a higher proportion of retirees (22.22%) compared to the group with asthma (9.04%); this difference may be explained by the younger average age of individuals who reported an asthma diagnosis. Fifty-eight percent to 60% of the participants lived in an urban area, whereas 41.67% of the sample and 39.76% of the participants with asthma reported living in rural areas of SJV.
In the entire sample, 56.25% of residents reported having one chronic condition that is worsen by air pollution, and 4.82% of participants with asthma reported having only that diagnosed condition; the majority reported having one (52.41%) other diagnosed condition, and 36.14% had two other diagnosed chronic diseases. Most survey participants in both groups reported being insured by employer-based or private insurance, and 4.52% of people with asthma reported being uninsured. Notably, people with asthma reported tobacco use (28.31%), vape use (16.87%), and cannabis use (21.08%). The supplemental material contains the categories not included in Table 2, including income level that were analyzed for group differences.
Finally, political affiliation was not statistically significant (p = 0.272) in measuring differences according to asthma status. SJV residents with asthma reported higher Democratic party affiliation (44.58%) compared to residents without asthma (39.58%). Similarly, Republican party affiliation was reported by people with asthma (30.72%), which was slightly higher than people without asthma in the sample (29.86%). The next highest reported political affiliation was no-party support among people without asthma (17.36%), which is slightly higher to people who had been diagnosed with asthma (15.06%).
Air quality information symmetry
Chronic diseases were found to be significantly related to the likelihood of variability between groups of survey respondents. Thus, Table 3 (and supplemental material) describes the extent to which people with reported chronic diseases (CDs) perceive air pollution, assess air quality information in the region, and trust such information compared with people without reported chronic diseases (NCDs).
Access to information, trust, and awareness were found to be statistically significant. Compared to residents without chronic diseases (NCDs), those with chronic diseases (CDs) who are sensitive to air pollution reported feeling the least informed about the quality of the air in their cities. Television, radio, and local health authorities were reported to be the most trusted sources of information by all groups, and more than half of all group respondents reported the information to be accurate and complete; 40% of people with chronic diseases (CDs) replied that the air quality information they received was accurate but incomplete.
In terms of air pollution awareness, all groups reported that most air pollution is perceived in the afternoon and in the summer season in SJV; this coincides with higher levels of ozone concentrations that are perceived by haze or smog during the warm season, which is endemic to the region. Most participants in each group responded that the method they use to check the air quality in their area is to observe if the mountain range in the region is clear (All: 42.58%, NCD: 40.49%, CD: 46.67%), with the highest proportion of people with chronic diseases indicating this as their primary option, followed by recommendations from the SJV Air District and checking the internet. Fourteen percent of people with chronic diseases reported not checking the air quality, whereas 8.78% of those with no chronic diseases did.
In contrast to the findings related to the time of day and season of the year for heightened awareness of air pollution, a high count of particulate matter (PM) in the air (All: 43.87%, NCD: 44.39%, CD: 42.86%), as well as mold/pollen presence (All: 39.35%, NCD: 38.54%, CD: 40.95%) were deemed to be the most likely meaning of a “bad air” day by all the groups alongside seeing the air dirty or polluted.
Value of health
All groups reported higher utility values when they responded that their current general health was excellent, and people with chronic conditions had the highest mean utility (U = 0.825). People with chronic conditions sensitive to air pollution also reported greater utility when their general health was good (U = 0.777) than did people with asthma (U = 0.747) or all (U = 0.763). People with asthma consistently reported the lowest mean utility values for all categories of general health status (see Fig. 1).

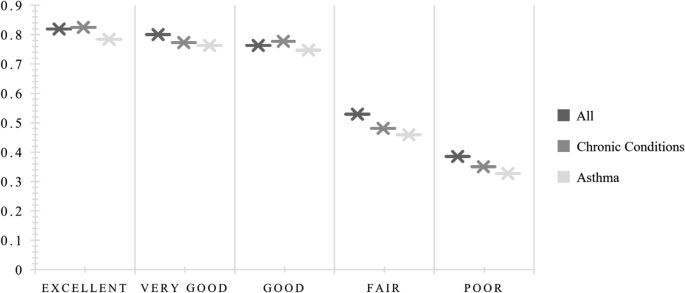
General health status by health utility state
Table 4 reports the estimated mean utility values of each health state and the entire sample by age group, sex, ethnicity, education, number of chronic conditions, rurality, proximity to freeways/highways, and tobacco, vape, and cannabis use. The mean utility value for all participants was U = 0.710, whereas that for people with chronic conditions was U = 0.691, and the lowest value was reported by people with asthma (U = 0.657).
The trend of general health status was followed in the estimated mean utility values by age group. People 60 years of age and older in the entire sample obtained the highest utility value for all (U = 0.778), and people 60 + years of age had the highest utility value for those with chronic diseases (U = 0.755). However, for people with asthma, the younger group (aged 18–25 years) reported the highest mean utility (U = 0.711).
Males reported higher utility values than females did and nonbinary residents of the SJV in all health states. People who reported high levels of education (a bachelor’s degree and above) also reported the highest utility for their current health. In terms of the number of chronic conditions, people with no chronic conditions reported the highest utility value (U = 0.771) compared with people with asthma, who reported comorbidities that were worsened by air pollution (U = 0.135).
People who live in rural areas in SJV and who have chronic conditions had greater health utility (U = 0.767), but people with asthma living in urban areas reported greater utility (U = 0.746) than did those with asthma living in rural areas of the Valley. Those residents who reported not living within one mile of a freeway or highway reported higher utilities in every health state, as did those residents who were not tobacco, vape, or cannabis users.
Using the logarithmic scale transformation for estimated utilities, Fig. 2 shows the utility curves for each health state to compare the health outcomes of all residents, people with chronic conditions, and people with asthma. In this analysis, the utility curve for people with asthma was lower than the curve for people with chronic conditions sensitive to air pollution and all the residents of the San Joaquin Valley.

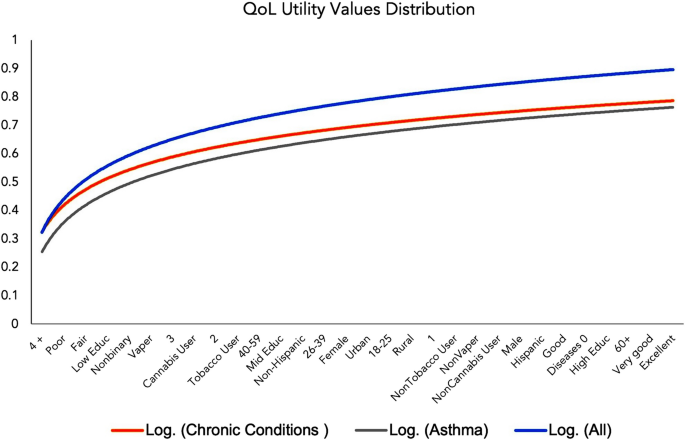
Health utility curves by health state
Favorability of policies and interventions
To determine which air pollution mitigation interventions are favored by SJV residents, an exploratory factor analysis was conducted using maximum likelihood estimation with fifty-two (52) policy items sorted into five thematic matrices. Primary components were rotated using varimax rotation to allow for factors to correlate. Tables 5, 6, 7, 8, and 9 show the factor loadings for each matrix after rotation, and acceptability means with corresponding standard deviations (SDs).
Factor Loadings: Hybrid and Electric Car Concerns (Table 5).
The items loading into the first factor related to hybrid and electric care adoption suggest that this component corresponds to concerns about electric charge access and availability in SJV cities and when traveling long distances. The second factor represents the expense concerns that residents have in acquiring and adopting clean cars, in which these vehicles are too expensive, and the purchase process is perceived as onerous. The third factor is related to hybrid and electric vehicle attributes.
Factor Loadings: Effectiveness of Organizations to Improving Air Quality (Table 6).
-
Factor 1 = Not Local
-
Factor 2 = Local
In assessing the effectiveness of organizations working to improve air quality in SJV, as shown in Table 6, a two-factor solution was recommended for parallel analysis. The first factor corresponded to organizations that are largely perceived as participating from a non-local perspective but rather from national, state, and regional levels, which included the SJV Air Pollution Control District. The second factor correlated with stakeholders with local influence, such as city and county officials, farmers, growers and ranchers, and community-based organizations.
Factor Loadings: Cost of Policies and Factors to Consider (Table 7).
-
Factor 1 = Cost
-
Factor 2 = Who Pays
This study asked about factors and costs that need to be considered when formulating air pollution control and mitigation policies for SJV residents. The midpoint for this scale was 3, and most of the mean acceptability indicators strongly support the inclusion of these considerations in policymaking. Two solution-correlated factors were identified: the cost to businesses and consumers, as well as the goal of making the air visibly cleaner, to guide local policymaking. Other consideration was the impact on low-income communities and the need for the neighboring Bay Area to reduce its air pollution, which often travels and accumulates in the SJV basin. A second factor correlated the reduction in fine particulate matter (PM2.5) and ozone, with agricultural practices to reduce air pollution, reduce heating from fireplaces, eliminate, or reduce pollution from large incinerators, commercial cooking, dairies, and pesticide drift.
Factor Loadings: Mitigation and Control Policy Statements (Table 8).
The strongest support was reported in the section on policy mitigation and control statements. The scale also had a midpoint of 3, and all attitudes were favored with the highest mean acceptability for the creation of a clean, fast, and reliable regional transportation system to connect SJV residents and their communities. A component correlated statements directly addressing strong action for air pollution control to protect the health of SJV residents. The second factor corresponds to the preservation of public space for public transportation, cycling, and pedestrians.
Factor Loadings: Persistence of Poor Air Effects (Table 9).
Finally, this study sought to understand the degree to which air pollution influences the persistence of disease outcomes and self-protective behaviors. Factor 1 correlated symptoms related to poor air, such as difficulty breathing; engaging in fewer outdoor activities; feeling depressed; irritation to one’s eyes, nose, and throat; skin problems; wanting to move to a less polluted place; asthma exacerbations; poor visibility; and worries about the environment that SJV children would inherit and are harming the elderly in the region. The second factor corresponds to having to do more to care for one’s skin and to stay healthy overall.
Predictors of support and unfavorability
Age had a positive predictive relationship with all the latent factors reported in Table 10, except for experiencing more symptoms related to poor air quality. Increases in years of education favor charges, expense, and car attributes as concerns for the adoption of hybrid and electric vehicles, as well as experiencing more symptoms due to poor air and having to take more personal actions to protect themselves. Decreases in estimated health utility values predicted favorability for all latent factors with the highest magnitude for experiencing symptoms due to bad air. Higher utilities were positively associated with supporting agencies such as the EPA, the state, and the U.S. government to control and mitigate air pollution in the region, but the finding was not statistically significant.
Five latent factors were negatively predicted by political views, indicating that, compared with liberal residents, neutral to more conservative leaning SJV residents were more likely to prefer non-local organizations to regulate air quality, to favor polluters to pay for their contamination, for strong air pollution control regulation, preservation of public space, and to report more symptoms or having to take more personal protective actions due to poor air quality. However, being low income, being fully employed, and insured by a public health program predicted favorability to having local agencies, such as farmers and ranchers, community-based organizations, and city/county governments regulate and control air pollution in the region. Living 1-mile from a freeway or highway followed those same predictions and favored who pays for the pollution that is produced in the region.
Males, non-Hispanic whites, and people who are employed negatively predict the acceptability of most factors except for males and people who are employed because of the effectiveness of local and non-local organizations; air pollution control measures; and the preservation of public space for pedestrians, cyclists, and public transportation. Whites were likely to have pervasive symptoms related to poor air and to take more personal protective actions to safeguard their health.
Having a child with asthma and rurality positively predicted the importance of car attributes in the adoption of hybrid and electric vehicles. Having asthma and having a child with asthma were also significant factors in predicting experiences of air quality-related symptoms and having to do more to protect their health. Nevertheless, having asthma is favorable for accounting the costs that air pollution control will impose on businesses and consumers.
link